

It’s 4 PM on a Tuesday, deep in the holiday rush. Your manager is staring at two completely contradictory pieces of data.
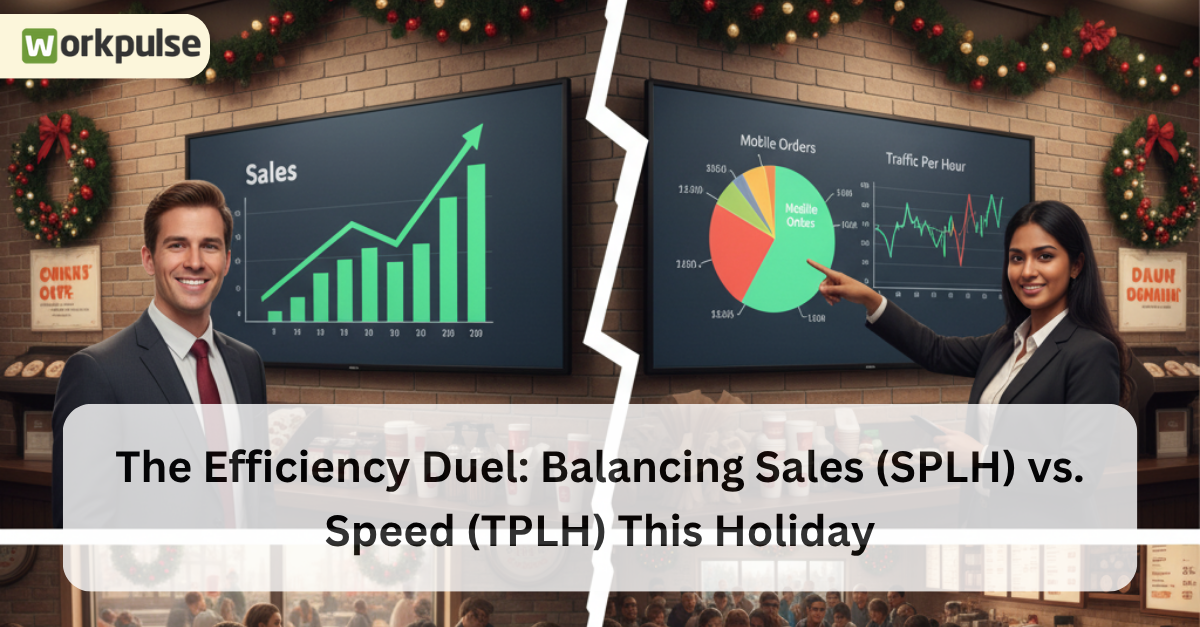
On one screen, their dashboard shows the Sales Per Labor Hour (SPLH) metric at $55—a new record. By this old-school metric, the store is a picture of perfect efficiency.
On the other screen, they see three new 1-star Google Reviews in the last hour, all citing “slow service.” The drive-thru timer confirms it, showing an average wait of 4 minutes and 30 seconds, well over the 3-minute QSR “red line.”
How can you be this profitable and this slow at the same time?
Welcome to the “Efficiency Duel,” the new QSR scheduling crisis. Scheduling only for sales (SPLH) is now a trap. In the new QSR economy, where up to 40% of your Q4 orders are digital, you are being flooded with low-dollar, high-workload transactions (like a single mobile app coffee) that don’t boost SPLH but crush your speed.
You are measuring sales but failing to measure throughput. This is why you must master the other critical metric: TPLH (Traffic Per Labor Hour).
This post will show you how to master this duel, using Workpulse RMS data to balance both metrics and protect your profits and your service times.
The SPLH Trap: Why Scheduling for Sales Alone Fails
For years, Sales Per Labor Hour (SPLH) has been the gold standard for QSR labor management. The formula was simple: schedule the fewest people to generate the most revenue. This single-metric focus has now become a dangerous trap, creating a “Good Numbers, Bad Service” paradox that costs you customers.
The “Good Numbers, Bad Service” Problem
Here is the scenario playing out in franchises every day: A manager, under pressure to maximize SPLS, schedules a skeleton crew for the afternoon. A sudden surge of 20 mobile app orders hits—all low-dollar, high-workload items.
Simultaneously, a high-value catering order and three cars pull into the drive-thru. The team is overwhelmed, but because the total sales value of those mobile orders is low, the SPLH metric still looks efficient.
The reality on the floor is chaos. The TPLH (Traffic Per Labor Hour) is in the red. The drive-thru line—carrying your high-dollar food orders—grinds to a halt. Customers wait over 3 minutes, hitting the QSR “red line” for service failure. Your SPLH looks great, but you just lost three high-value customers who will now leave 1-star reviews citing “slow service,” permanently damaging your reputation.
The Financial Cost of “Bad Speed”
You are still wasting 5-10% of your labor spend if you are staffed for sales but failing on speed. The profit you gained from that high SPLH is immediately erased by customer churn. Data consistently shows that for QSRs, speed and accuracy are the top drivers of customer retention. When you sacrifice TPLH for SPLH, you are telling your customers that your efficiency is more important than their time.
The TPLH Mandate: Why Speed is Your New Profit Center
The fatal flaw in the “SPLH-only” model is that it measures dollars, not output. To survive the modern holiday rush, you must obsess over your speed. This requires mastering the metric that tracks it: TPLH (Traffic Per Labor Hour).
TPLH is the critical counter-metric that measures throughput—how many transactions (or customers) your team can handle per hour, regardless of their dollar value.
The Holiday Reality: Volume Over Value
During the Q4 rush, TPLH is the leading indicator of success. Why? Because the bottleneck in your store is not the register; it’s the prep line, the drink station, and the bagging counter.
- The Principle: A team that can handle 100 transactions per hour (even if many are low-dollar mobile drinks) will be more profitable than a team that can only handle 50. High throughput keeps the entire system (drive-thru, mobile, in-store) moving, prevents bottlenecks, and maximizes total sales potential.
- The Data: When drive-thru wait times increase by just 10 seconds beyond the 3-minute mark, customer satisfaction plummets, and a percentage of those customers will not return. TPLH is the metric that guards your wait times.
The Problem: You Can’t “Feel” TPLH
A manager can feel a high-sales hour. They cannot, however, accurately feel the difference between 80 transactions and 95 transactions. You cannot guess your TPLH. You need a system that tracks every single order, from every single channel, and divides it by the labor hours worked in that same 15-minute window.
The RMS Solution: A Unified Dashboard for the Duel
The goal is not to abandon SPLH (Sales Per Labor Hour) for TPLH (Traffic Per Labor Hour). The goal is to master the balance between them—and you cannot win this duel if you are blind to one of your opponents.
This is where Workpulse RMS provides the essential, unified command center.
Balancing, Not Choosing
Instead of forcing you to choose one metric, the RMS dashboard is the “cockpit” that displays both SPLH and TPLH in real-time, side-by-side, for every 15-minute increment.
- The Capability: A manager can look at a single screen and see the full story. For the first time, they can diagnose the type of problem they are having.
- The Diagnosis:
- High SPLH, Low TPLH: “My sales dollars are high, but my speed is terrible. I have a throughput problem.”
- Low SPLH, High TPLH: “My line is moving fast, but my sales are low. I have a profitability or upselling problem.”
Making the Data-Driven Decision
This real-time diagnosis allows managers to stop guessing and start making precise, data-driven scheduling decisions that save money and protect service speed.
- The Example: A manager reviews the RMS dashboard and sees a clear pattern: TPLH (traffic) crashes every day at 4 PM, precisely when the local high school empties out and mobile drink orders flood the system. In the old SPLH-only model, they would just see a slight dip in sales and do nothing.
- The Solution: Armed with TPLH data, the manager makes a different call. They adjust the 4 PM schedule to add one “prep/bagging” person (a TPLH role to handle volume), not another cashier (an SPLH role to handle sales). This single, data-driven change fixes the bottleneck, keeps the drive-thru moving, and saves the 1-star reviews, all while keeping labor costs controlled.
Win the Duel, Win the Holiday
Scheduling for the 2025 holiday season is no longer a simple equation. It is a complex, high-stakes duel between two competing metrics: Sales (SPLH) and Speed (TPLH).
Relying on an outdated, SPLH-only model is a trap. It guarantees you will look efficient on a spreadsheet while 1-star reviews for “slow service” pile up, silently eroding your customer base and costing you the 5-10% of your labor spend you thought you were saving.
Winning the holiday rush requires seeing the full picture. You must have a system that shows you both metrics in real-time.
Workpulse RMS provides this unified dashboard. It is the only tool that allows your managers to stop guessing and start making precise, data-driven decisions. It empowers them to balance the duel—adding a “prep” person for a TPLH problem or an “upsell” person for an SPLH problem.
Don’t let high sales blind you to the catastrophic cost of slow service. Use Workpulse RMS to see both metrics, master the duel, and ensure your labor efficiency is perfectly balanced with 5-star service speed.

